A week ago I was on .NET Developer Days conference. There are lot of tips which I would like to share but I will present only a small portion of the key takeyways which subjetively seemed most intersting for me. Don’t hate me for my somewhat short explanation of topics here, the main purpose of the post is to aggregate the bullet points from conference and reference the most interesting stuff 🙂
DAY 1
The Intelligent Cloud and Intelligent Edge
by Scott Guthrie & Simona Cotin
- role of cloud is increasing in nowadays business, we are switching from talk of GB’s transferred per second to TB’s transferred per second
- more and more companies are using Azure to help them with running the business. Car manufacturers like Audi, BMW etc. are using Azure to help them process lots of data coming from sensors. More about that here
- part of the presentation was given by Simona Cotin, who spoke mainly about usage of Microsoft products in Business. She spoke about Power BI which can be used as a tool to process huge amounts of data and present that data in an easy to grasp human readable format. It also enables quick analysis thanks to cloud calculation power. For me the most interesting part of Simona’s presentation was the part connected with Power APPs. In short, it’s a platform which allows non-programmers to create simple business applications from ready to use blocks. Most of the logic in such applications is written similarly to excel formulas.
Azure Essentials – Unplugged Q&A
by Scott Guthrie
That was also a well-prepared Q&A session with questions noted down at the beginning and then answered in order. The most interesting question for me was “How is Azure more secure than other platforms”? . Main focus of the answer was on showing the holistic and user friendly approach to security of Apps. Scott told about the tools which are available for developers (Azure monitor, security center etc.). The most interesting feature was the checklist which was automatically created based on your app design, containing tips and methods on how to improve the system. To learn more check out the video here:
Docker and Kubernetes for .NET Developers
by Elton Stoneman
I was working with Docker and Kubernetes for some time so for me it was a pretty basic presentation showing a high level view of Docker&K8s and methods on porting three different apps to containers, but some things are worth mentioning and remembering.
- when you use official images from the docker registry you get updates of software provided in them
- when you want to run a few apps locally it’s best to use docker compose for that – it will help you deploy them together faster
- one of the apps was handled by windows container. It showed how easy it can be to port some old legacy apps to container and move your system to a new infrastructure
- another part of presentation was about Azure AKS – the platform for managing kubernetes clusters as as service. It was visible that a significant amount of work had been put in to make the developer experience as seamless as possible
I Don’t Feel so well… Integrating Health Checks in Your .NET Core Solutions
by Alex Thissen
An interesting talk showing that in the age of Docker and Kubernetes we should change our perception of checking app health. .NET Core has already improved that process by incorporation of health checks by introduced by AspNetCore.Diagnostics.HealthChecks namespace. You can find there a nice GUI view of health check there, for example:

Alex was also speaking about Liveness and Readiness probes in Kubernetes (more about them here ) and how they can help us when we want to intoduce zero downtime deployments. Among many other interesting things, Alex talked about how Kubernetes probes can harm our app. In the shortest therms, liveness and readiness probes have a default timeout of the request (defaults to 1 sec), so if we don’t set this number to a bigger value, and our application hangs for just a little bit over 1 sec – it will be restarted, despite beign healthy !
Afternoon Keynote: The History of .NET
by Richard Campbell
If in the future you have the possibility to attend one of Richard’s presentations- go for it. His knowledge, attitude and presentation skills will hold your attention from start to finish. In this one Richard showed us the history of .NET during the rise of Microsoft. He told us about evolution of Windows, the influence of Apple and the process of making Microsoft into the company which we know today. He told a great story in a very interesting way 🙂
DAY 2
Debugging With Visual Studio Beyon ‘F5’
by Dror Helper
In this really cool presentation focused on Visual Studio tools which can help you in debugging, Dror presented the following general debugging rules:
- Reproduce the problem
- Get to where the issue happens
- Analyze the system state
- Create hypothesis
- Fix the bug
- Verify your solution
- Celebrate 🙂
These rules are somewhat similiar to the ‘9 debugging rules’ which I described in a previous post here.
Some of the presented methods/tools shown are:
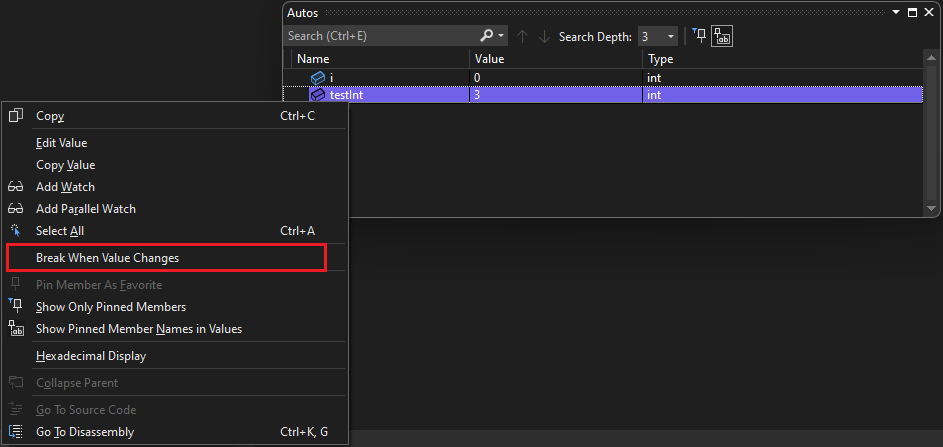
Break when value changes – self explanatory I guess 🙂
Parallel watch – which you can use to see values of parameters in different threads
More details here
Parallel Task & Stack – check this out if you need to see the relationship between tasks/threads or call paths of threads

More details here
Debugging Asynchronous Scenarios in .NET
by Christophe Nasarre and Kevin Gosse

A very useful presentation for people who lack tools to see what’s under the hood of call stacks and who want to browse back through the stack trace.
The presentation was divided in to 2 parts, both of which used memory dumps to find the bug.
The first case was about a service which refused to stop when the application was deployed on the server.
Here is a shortened debugging path:
-take a memory snapshot and download it on your machine
procdump -ma <pid>
Using this you can check the parallel stack in Visual Studio. The stack which you are going to see in VS is a snapshot of threads and their properties.
Now you can see the call stack of each thread (see above image regargin parallel stack).
Without digging to much into the details of the debugged case, the guys were able to see which method was called and analyze the case, this was thanks to call stack of blocked thread.
The guys also showed the internals of methods decompiled by ILSpy – this is a tool which can really help you when trying to understand what happens inside the code of external dependencies.

They were also speaking about checking the exact address of an object using only the name of a variable. All you need to do is open the VS tab:
Debug -> Windows -> Memory
on that screen if you pass name of the variable in Address block, you will get the specific address of the object in return. This address can then be used in WinDBG.

When you have the address of the object it’s possible to check the references of that variable in WinDBG by using the SOSex extension (more about that here)
And that’s a tip of the iceberg in terms of this presentation so, if you want to see the whole talk you can watch it on YouTube here
Debug like a Pro – Kubernetes Edition
by Kamil Mrzygłód & Sławomir Kwasiborski
A very interesting presentation (partially narrowed down to Microsoft stack) about 3 tools which allow you to quickly attach the debugger to applications running inside K8s clusters. This was actually very interesting subject, because sometimes there is no option to set up a fully functioning cluster on minikube. It just takes too long, or else some parts of the system just cannot be ported to your local environment.
First method – use Azure Dev spaces
If you are using the Azure stack it’s definitely the way to go. I haven’t been using that one myself but it looked very easy to deploy the application using dev spaces and even easier to debug your app inside that space.
When you enable AZDS on your cluster by running:
az aks use-dev-spaces -g <group> -n <namespace>
all you need to do is click “prepare configuration” in VS Code (remember when had to write all those that debug configs ourselves ? 🙂

Then just launch your app and debug it – that’s it !

Telepresence

This one will require more setup than AZDS but its vendor agnostic. The whole idea of telepresence is based on creating a proxy which will route your networking to your cluster, but give you the impression of working locally on your app. I don’t want to duplicate the docs here, so if you’re interested in more details you can find it here.
Summary:
That was a pretty long post wasn’t it? 🙂 I am glad that you made it to the finish. To sum up, .NET Developer Days seems like good conference which is worth visiting. There are 4 paths assuming different levels of knowledge of the presentation subjects, so you can almost always pick something which suits you.